Customise your Facebook Campaign Manager Columns
If you aren’t customising the Columns in your Facebook Ads Manager, then you aren’t seeing the full picture. Discover how to customise, save, and set default columns to keep on top of the metrics that matter.
Why You Should Customise Your Ads Manager Columns
When optimising campaigns in the Facebook Ads Manager, I am initially trying to understand the story that the data is telling me.
If I’m not looking at the metrics that matter, it’s like reading a story with chapters missing.
Facebook does a half-decent job of showing some< data, but it’s not enough.
Even with thirteen pre-set column categories (see yellow arrow below), Facebook still misses vital metrics that can only be accessed by Customising your Columns (see green rectangle below).
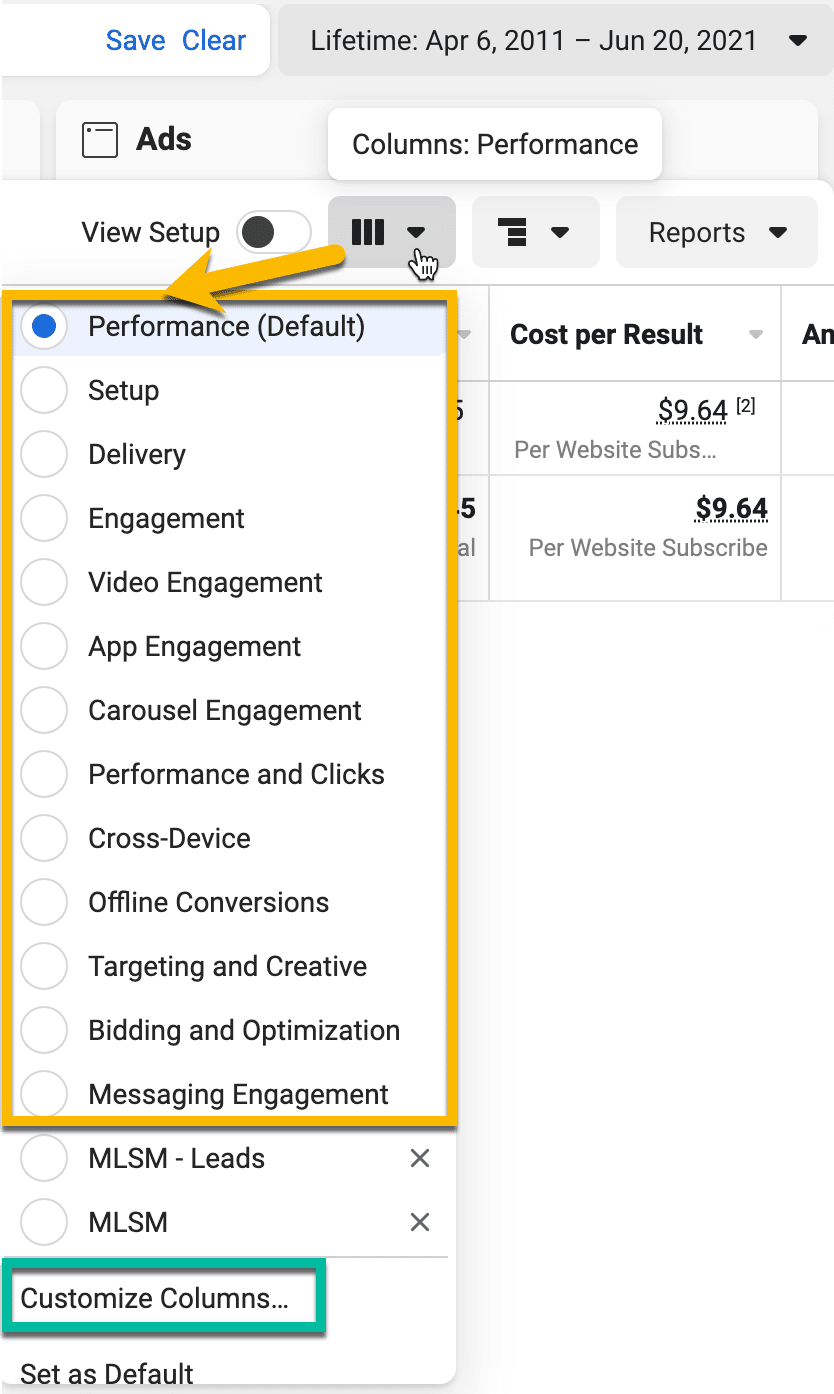
Not only are these vital metrics missing, but to see helpful metrics like Frequency, you’d need to switch between different pre-set columns.
The Columns to Save
Although there are a seemingly endless number of metrics to choose from, the below are my top pics if your primary objective is to convert website traffic into sales:
Settings:
- Attribution Setting: The attribution setting is a finite period of time during which conversions can be credited to your ads and used to inform campaign optimization.
- Date Created: The date when the campaign, ad set or ad was newly created.
- Date Last Edited:< The date when the campaign, ad set or ad was last edited and saved as a draft or submitted.
- Last Significant Edit: The most recent date you made a significant edit to your campaign or ad set, which may restart the learning phase. A significant edit is when you pause your ad set or make a change to optimization event, audience or creative. Changes to bid strategy or budget may also be significant, but it depends on the magnitude of the change.
- URL Parameters: The URL parameters used to track advertising effectiveness. This column does not apply to campaigns or ad sets, only ads.
- Facebook Pixel: The Facebook pixel code used to report conversions and track website activity. This column does not apply to campaigns or ad sets, only ads.
Basic Metrics:
- Quality Ranking: A ranking of your ad’s perceived quality. Quality is measured using feedback on your ads and the post-click experience. Your ad is ranked against ads that competed for the same audience. This metric is an ad relevance diagnostic and does not apply to campaigns or ad sets, only ads.
- Engagement Rate Ranking: A ranking of your ad’s expected engagement rate. Engagement includes all clicks, likes, comments and shares. Your ad is ranked against ads that competed for the same audience. This metric is an ad relevance diagnostic and does not apply to campaigns or ad sets, only ads.
- Conversion Rate Ranking: A ranking of your ad’s expected conversion rate. Your ad is ranked against ads with your optimization goal that competed for the same audience. This metric is an ad relevance diagnostic and does not apply to campaigns or ad sets, only ads.
- Impressions: The number of times your ads were on screen.
- CPM: The average cost for 1,000 impressions.
- Reach: The number of people who saw your ads at least once. Reach is different from impressions, which may include multiple views of your ads by the same people.
- Frequency: The average number of times each person saw your ad.
- Post Saves: The total number of times your ad has been saved.
- Post Comments: The number of comments on your ads.
- Link Clicks: The number of clicks on links within the ad that led to advertiser-specified destinations, on or off Facebook.
- CPC (Link Clicks): The average cost for each link click.
- CTR (Link Clicks): The percentage of times people saw your ad and performed a link click.
- Landing Page Views: The number of times a person clicked on an ad link and then successfully loaded the destination webpage or Instant Experience. To report on landing page views, you must have created a Facebook pixel.
- Cost per Landing Page View: The average cost for each landing page view.
- Optimization Events: The number of times your ads achieved the outcome your ad set is currently optimized for, based on your chosen attribution setting.
- Cost per Optimization Event: The average cost per optimization event from your ads, based on your chosen attribution setting.
n.b. You may wish to add more engagement metrics here, such as video Thru-Plays and Post Shares.
eCommerce Conversion Metrics:
n.b. You should have set up the below events by now if you read my blog ‘What a Facebook Pixel Helper is and Where You Can Find It’
- Subscriptions
- Leads
- Phone Number Clicks
- Searches
- Content View (Total, Cost, Value)
- Adds to Cart (Total, Cost, Value)
- Checkouts Initiated (Total, Cost, Value)
- Purchases (Total, Cost, Value)
- Purchase ROAS (Return on Ad Spend)
Non-eCommerce Conversion Metrics
n.b. You should have set up the below events by now if you read my blog ‘What a Facebook Pixel Helper is and Where You Can Find It’
- Content View (Total, Cost)
- Leads (Total, Cost)
- Registrations Completed (Total, Cost)
- Contacts (Total, Cost)
- Location Searches
- 30 Seconds Time on Site
- 60 Seconds Time on Site
- 90 Seconds Time on Site
- 120 Seconds Time on Site
Applying and Saving Your New Columns as the Default
1. Click the Columns tab, then ‘Customize Columns…’
![]()
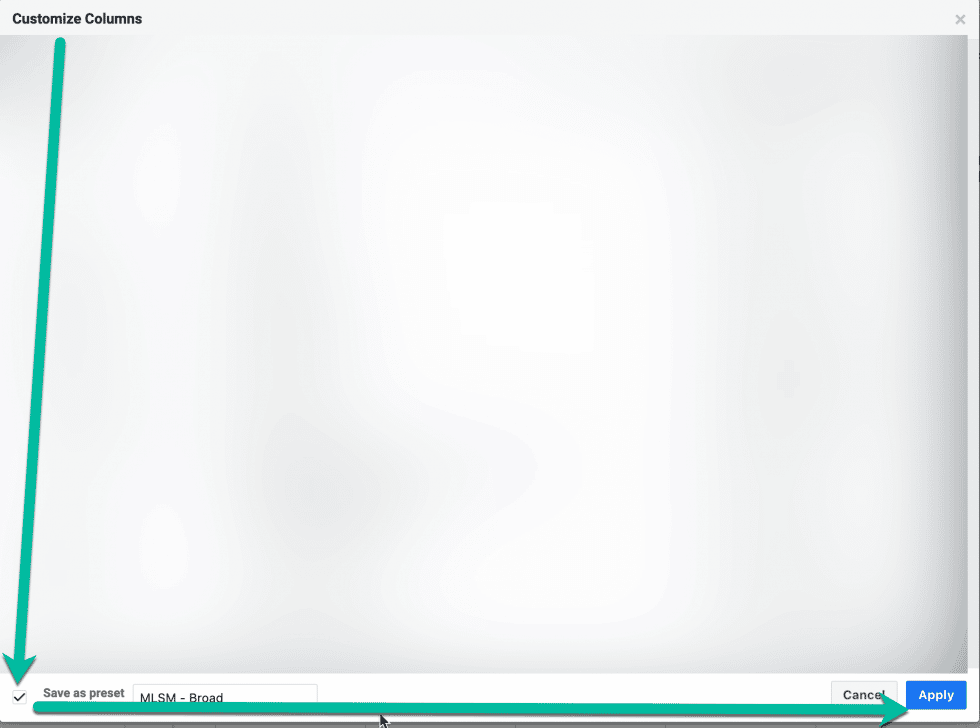
2. Select all of the columns you’d like to see when optimising your campaigns, then click ‘Apply’.
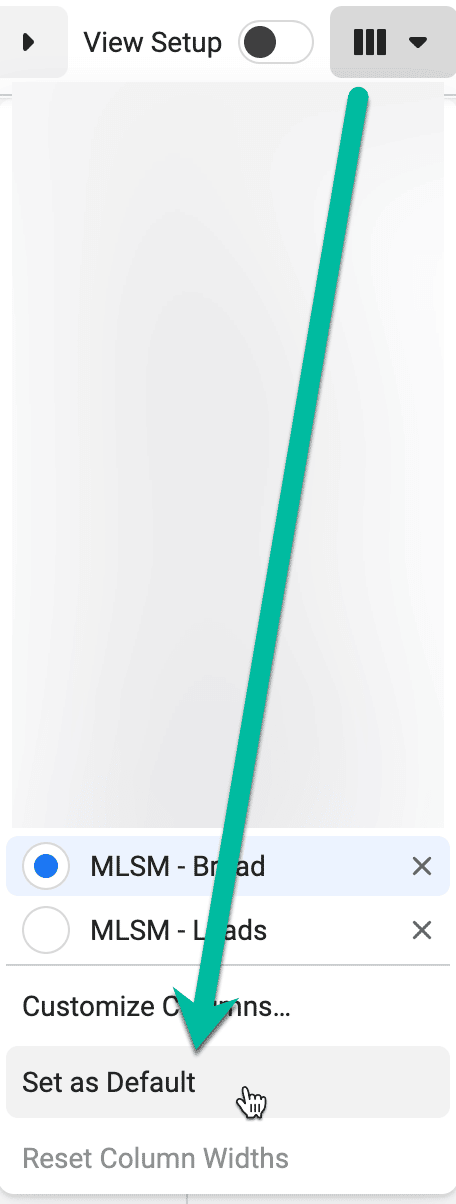
Click the columns tab again, ensure your new set of saved columns is selected, then click ‘Set as Default’.
Time to Optimise!
Now that you’ve customised, saved and set your new default columns, it’s time to review each metric in your ads manager and optimise your campaigns accordingly.
Don’t have the time or team to optimise your campaigns? Simply click here to book a quick 15-minute chat to learn how my team and I help.